The international scientific and analytical, reviewed, printing and electronic journal of Paata Gugushvili Institute of Economics of Ivane Javakhishvili Tbilisi State University
THE ASSESSMENT OF INCOME INEQUALITY IN GEORGIA: THE URBAN-RURAL DISPARITY OF INCOME
DOI: 10.36172/EKONOMISTI.2020.XVI.03.IASHVILI
Annotation
Income inequality is a significant issue in Georgia and requires various studies from various point of view.
The purpose of this article is to analyze and overview the income inequality in Georgia. The article mostly emphasizes its spatial distribution and key aspects from the urban-rural perspective. As well as, Government’s fiscal redistribution impact.
For the article’s objectives author has used the data of the Integrated Household Survey by the National Statistics Office of Georgia (Geostat). To estimate the income inequality, the Gini index (by income) was used as well. The one provided by Geostat and Gini index (by income) of the Standardized World Income Inequality Database (SWIID8_2) (Solt, 2019).
As the analysis of Integrated Household Survey shows that real income inequality is higher than it is presented by Geostat. The difference between the urban and rural areas is high and urban area income exceeds 1.8 times to rural area income. Despite the fact, that pensions, stipends, family allowances and benefits decreases the mentioned difference. Still, during the past decade, income absolute redistribution is 0.10 and the government needs to obtain more effective fiscal tools to decrease income inequality. Another significant issue is that borrowing plays one of the key roles in rural area income. In fact, in rural areas borrowing and dissaving per capita is 30% of total income per capita excluding pensions, stipends, and allowances. The latest restrictions by National Bank of Georgia on money lending policies will complicate money borrowing for citizens and will increase the inequality between urban and rural areas in the total country as well. Taking into consideration that non-cash income in total income plays an equalizing role and it can’t be considered as real income.
Keywords: Income inequality, Gini index, inequality in Georgia, rural-urban spatial distribution
Introduction
Income inequality is a significant problem. It is connected with issues and indicators such as – poverty, extreme poverty, and economic growth. Growing inequality can lead to social instability, reducing the economic growth in the long-term and rising poverty among the population. Besides, big differences between the households’ and individuals’ income forces the government to create a social friendly budget and raises the share of social expenditures in total expenditure. Income inequality issues are not studied enough in Georgia. The latter needs to be addressed and analyzed from the different perspective. Furthermore, the government of Georgia set the goal to reduce the Gini index to a certain point in its development strategy. (Social–Economic Development Strategy of Georgia). As for the present situation, the latest data (2017) provided by World Bank shows that Georgia has one of the worst performance in the region. For instance, the Gini index (World Bank Estimate) in Georgia and Armenia are 37.9 and 33.6 respectively. According to the same data in the Eastern Partnership countries (Eap), Georgia is the worst performer in terms of income inequality.[1]
Furthermore, the income issues concern Georgian citizens as well. For instance, according to the IRI survey conducted in September–October of 2019 68% (all mentions) of surveyed people think that the most important problem the country is facing is unemployment. 53% stated the same problem as the first mention. In the second place are high prices and the cost of living 45% and 18% all mentions and first mentions respectively. In the third place comes poverty (21% and 6%). (IRI, 2019) The same social-economic issues held the first 3 places during the previous survey (IRI, 2019). Moreover, the average monthly nominal earning of employees in 2018 accounted for 1068 Georgian Lari. (National Statistics Office of Georgia, 2018). While almost 50% of the cash income percentage distribution comes on wages and 73%[2] of the declared salaries (1.13 million of persons) (Business Media Georgia, 2019) in 2018 are less than 1068 GEL (372 current US dollars).
Literature Review
In terms of the literature, there are various studies which suggest different perspectives and impacts of income inequality on economic growth, human well-being and sustainable development. Generally, income inequality is a significant issue. It is connected with problems and indicators such as – poverty, extreme poverty, and economic growth. Growing inequality can lead to social instability, reducing the economic growth in the long-term and rising poverty among the population. Besides, big difference between the households’ and individuals’ income force the government to create a social friendly budget and raises the share of social expenditures in total expenditure. Furthermore, while the expenses of inequality are rising, in some cases government may face a trade-off between economic growth and well-being (Furceri & Loungani, 2015). But some scientists claim that income inequality might have a positive impact on economic growth. For instance: (Kuznets, 1955), (Kaldor, 1957). Thus, Income inequality issues are broadly covered by various studies from different perspectives. For instance:(Atkinson, 1970), (Acemoglu & Robinson., 2012), (Addison & Cornia, 2001), (Milanovic, 2002), (Solt, 2016). But speaking about Georgia, there can’t find much. Only a few papers cover the issues of income inequality in Georgia. (Merab Kakulia, 2017), (Yemtsov, 2001), (World Bank Group, 2016). The mentioned studies mostly focus on poverty and within its frame, income inequality is also discussed. Accordingly, income inequality issues are not studied enough in Georgia. The latter could be considered as a novelty and significant problem.
Data and Methodology
To analyze income inequality in Georgia 3 different data will be used. The first one is Integrated Household Survey provided annually by Geostat. Also, the domestic Gini index (calculated by income method) provided by Geostat as well and Gini index of Standardized World Income Inequality Database (SWIID8_2).
In the first place, Integrated Household Survey data will be discussed. According to data average monthly income per capita is increasing both in urban and rural areas, accordingly in the country in general. Also, in terms of income inequality, the difference between urban and rural areas is not very big. But in-depth analysis shows that excluding pensions, stipends, family allowances, benefits, and non–cash income from the total income[3] raises the difference between urban and rural areas almost as much as 1,8 times. (See diagram 1)
Diagram 1: Total Income per capita, urban-rural areas.
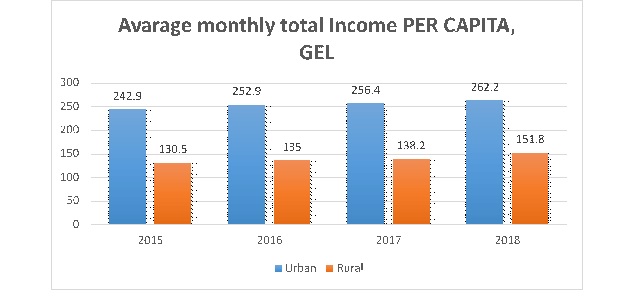
Source: Authors calculations based on Integrated Household Survey data
The excluded two types of income play a significant role in equalizing the income inequality. Average monthly pensions, stipends, family allowances and benefits per capita is higher in rural areas than in urban. (See diagram 2):
Diagram 2: Average monthly pensions, stipends, etc. per capita, urban-rural areas
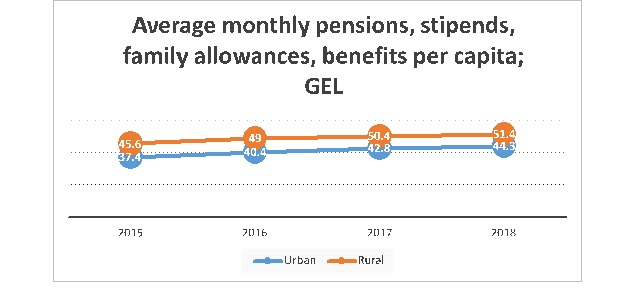
Source: Made by the author based on the Integrated Household Survey
In terms of non–cash income. It represents the consumption of agricultural products of own production, estimated at current prices. The latter plays a key role in equalizing the inequality calculation by total income (Merab Kakulia, 2017, p. 15). But it can’t be considered as real income. Especially for urban areas. To emphasize the latter, employment by economic status must be analyzed. In 2018 employed people accounted for 1694.2 thousand. 833.4 thousand of which are self–employed. (National Statistics Office of Georgia, 2019). If the latter will be examined from the urban-rural perspective. The picture in 2018 will be is as follows. (See table 2):
Table 2: Self–employment in urban-rural areas, 2018
|
Self-employed (thousand) |
Self-employed in rural areas (thousand) |
Self-employed in urban areas (thousand) |
|
833.4 |
647.9 |
185.6 |
Source: National Statistics Office of Georgia
77,74% of all self-employed comes in rural areas. Furthermore, 30% (659 000) of all employed (1 694 200 659) are employed in Agriculture, Forestry and Fishing. The latter created only 6.9% of the total Gross output of Georgia in 2018 (National Statistics Office of Georgia, 2019). Furthermore, in 2018 average monthly non-cash income per capita in rural areas accounted for as many as 39.6 GEL while the wages were 66.9 GEL (National Statistics Office of Georgia, Statistical Yearbook of Georgia 2018, 2019, p. 53). Of course, it is not a surprise that non–cash income is minor in urban areas. Thus, it can be stated that non–cash income equalizes, income inequality, in other words— it decreases the Gini index. Thus, Geostat’s Gini index by total income which in official calculations includes pensions, stipends, family allowances and benefits and non-cash income is relatively lower and doesn’t help to describe the real situation. (See table 1):
Table 1: Gini index by income
|
Gini index |
|
|
Year |
By total Income |
|
2006 |
0,43 |
|
2007 |
0,44 |
|
2008 |
0,43 |
|
2009 |
0,43 |
|
2010 |
0,44 |
|
2011 |
0,43 |
|
2012 |
0,42 |
|
2013 |
0,40 |
|
2014 |
0,40 |
|
2015 |
0,40 |
|
2016 |
0,40 |
|
2017 |
0,41 |
|
2018 |
0,39 |
Source: National Statistics Office of Georgia
The study (Merab Kakulia, 2017, pp. 26-27) showed that the increase of total cash inflows (total cash income and transfers + other cash inflows (money borrowing, property disposal)) exceeds total cash and transfers. Moreover, in the past few years, the total cash inflows exceed the total income (total cash income and transfers + non-cash income). Accordingly, this leads to the trend where people tend to sell property or borrow money to improve their living conditions and income. Especially in rural areas, whereas, for instance in 2018 average monthly borrowing and dissaving per capita accounted for the 1/3 of total income (excluding non-cash income and pensions, stipends, family allowances, benefits). Furthermore, in the same year loans and dissaving accounted as high as 50% of average monthly wages per capita in rural areas. One of the possible results out of this is that it reflects to huge amount of overdue loans. For instance, according to the data of www.Vali.ge[4] 615,164 people have overdue loans (Mostly consumer loans under 2000 GEL). The total number of loans is 1 387 296. It should be mentioned that in 2018 The National Bank of Georgia restricted money lending policies for banks and microfinance organizations. These actions have already impacted the ratio of borrowing in average monthly income per capita, mostly in rural areas. Thus, income inequality from the urban-rural point of view will increase.
To overview the income inequality in Georgia, from a different perspective. SWIID data can be useful. SWIID data calculates two different types of inequality. The first one is the Gini Market. This is the Gini index before the transfers and taxes. The latter shows the real inequality in countries before the income will be redistributed by the government using taxes, transfers and other fiscal tools. The second type of index is Gini disposable. This index shows income inequality after the transfers and taxes. There is also an index that shows income absolute redistribution:
Absolute Redistribution=Gini Market - Gini Disposable. (1)
Absolute redistribution shows how direct taxes and transfers try to minimize income inequality. According to SWIID data Gini Market in Georgia is as follows: (See Diagram 3):
Diagram 3: Gini Market index in Georgia
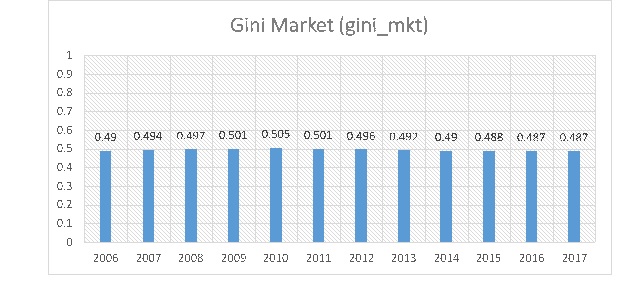
Source: Calculated by the Author using SWIID data.
As seen from the Diagram market inequality is high in Georgia. Its trend is stable and the decline is minimum over the last 12 years. If we compare the market and disposable Gini index the picture will be as it is shown in Diagram 4:
Diagram 4: Gini Market and Gini Disposable in Georgia
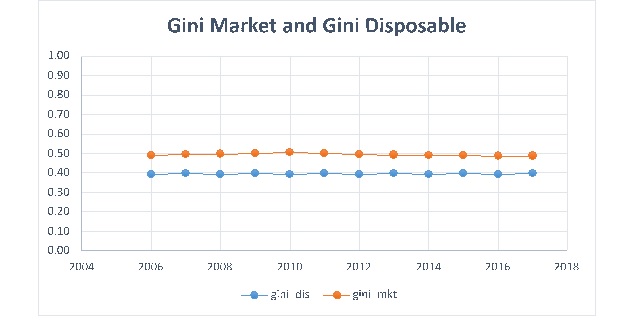
Source: Calculated by the Author using SWIID data
As seen from the Diagram Gini Disposable is less than the market inequality. Consequently, the Government uses its fiscal tools to help to redistribute the income. Usually, income redistribution tools are more effective in developed countries. The direct taxes and transfers help to reduce the Gini coefficient more than 0.17 (from 0.48 to 0.31)—while in developing and in emerging markets it is much less—0.04 (from 0.49 to 0.45). (United Nations Development Programme, 2019). The picture in terms of absolute redistribution in Georgia is not drastically different.
Table 3: Absolute Redistribution of Income in Georgia
|
Year |
2006 |
2007 |
2008 |
2009 |
2010 |
2011 |
2012 |
2013 |
2014 |
2015 |
2016 |
2017 |
|
Absolute Redistribution |
0,10 |
0,10 |
0,11 |
0,11 |
0,11 |
0,11 |
0,10 |
0,10 |
0,10 |
0,09 |
0,10 |
0,09 |
Source: SWIID data
The table shows that while pensions, stipends, family allowances, and benefits play an important role in minimizing the income inequality in urban-rural areas. The cumulative effect of absolute redistribution of income in the total country is almost the same during the last decade. It’s worth mentioning that absolute redistribution is higher than in developing countries or in emerging markets. But the government needs to add more effective fiscal tools to redistribute the income more effectively.
Conclusions
Income inequality is a significant issue in Georgia. As the data shows the market inequality is steadily around 0.5 more than a decade. While the government transfers, pensions, family allowances play decent role to minimize the income inequality between the urban and rural areas, income absolute redistribution index has stable trend and accounts for 0.10. The latter is more than the same average index in developing and emerging markets but as the data shows the government needs to find better fiscal tools, or improve the existing ones to minimize the income inequality between the urban and rural areas and in the total county as well. Taking into account the fact, that the real income inequality is way higher than it is presented by Geostat’s Gini index calculated by total income. Another concern regarding income inequality is that in rural areas the share of loans per capita is quite high. People tend to get consumer loans to improve their income and afterwards they can’t service their loans. Accordingly, it reflects in more than 600 000 people who have overdue loans. Furthermore, the restrictions on money lending policies for banks and microfinance organizations will make complicated for people in rural areas to have a consumer loan. Accordingly, income inequality will increase between the urban and rural areas and in the total country as well. While non–cash income equalizes the difference in income between the urban and rural areas, the latter cannot be considered as real income.
Acknowledgement
This work was supported by Shota Rustaveli National Science Foundation of Georgia (SRNSF) [PHDF-18-1264] Impact of Inequality on Economic Growth. Case of Georgia.
References
- Acemoglu, D., & Robinson., J. A. (2012). Why Nations Fail. The Origins of Power, Prosperity and Powerity. New York: Crown Publishers.
- Addison, T., & Cornia, a. G. (2001). Income Distribution Policies For Faster Poverty Reduction. Helsinki : UNU/WIDER.
- Atkinson, A. B. (1970). On the Measurement of Inequality. JOURNAL OF ECONOMIC THEORY 2, 244-263.
- Business Media Georgia. (2019, July 04). www.bm.ge. Retrieved December 02, 2019, from https://www.bm.ge/ka/article/tveshi-5000-larze-magali-xelfasi-saqartvelos-mosaxleobis-mxolod-05-s-aqvs/36426
- Furceri, D., & Loungani, P. (2015). Capital Account Liberalization and Inequality. International Monetary Fund.
- IRI. (2019). Public Opinion Survey Residents of Georgia; May 20 – June 11, 2019. Tbilsi: Center for Insights in Survey Research .
- IRI. (2019). Public Opinion Survey Residents of Georgia; September - October, 2019. Tbilsi: Center for Insights in Survey Research.
- Kaldor, N. (1957). A model of Economic Growth. Economic Journal, 67(268), 591-624.
- Kuznets, S. (1955). Economic growth and income inequality. American Economic Review, 45(1), 1-29.
- Merab Kakulia, N. K. (2017). Chronic Poverty and Income Inequality in Georgia; Economic – Statistical Research. Tbilisi: Georgian Foundation for Strategic and International Studies.
- Milanovic, B. (2002). Decomposing World Income Distribution: Does The World Have A Middle Class? Review of Income and Wealth. Series 48, number 2, 155-178.
- National Statistic Office of Georgia. (2019). HOUSEHOLDS INCOMES AND EXPENDITURES. Tbilisi: National Statistic Office of Georgia.,.
- National Statistics Office of Georgia. (2018). www.geostat.ge. Tbilisi.
- National Statistics Office of Georgia. (2019). Statistical Yearbook of Georgia 2018. Tbilisi: Geostat.
- National Statistics Office of Georgia. (2019). www.geostat.ge. Tbilisi.
- Solt, F. (2016). The Standardized World Income Inequality Database. SOCIAL SCIENCE QUARTERLY, 1268-1281., 1268-1281.
- Solt, F. (2019). Measuring Income Inequality Across Countries and Over Time: The Standardized World Income Inequality Database. Preprint, 1-23.
- United Nations Development Programme. (2019). Human Development Report 2019. New York: United Nations Development Programme.
- World Bank Group. (2016). GEORGIA: RECENT TRENDS AND DRIVERS OF POVERTY REDUCTION. Washington: World Bank.
- Yemtsov, R. (2001). Inequality and Income Distribution in Georgia. Washington : World Bank.
[1] There is no data of Azerbaijan Since 2005.
[2] Authors own calculations, based on Revenue Service data.
[3] Total Income includes total cash income and transfers + non-cash income
[4] One-time charity action of debt settlement program. Pardoning the overdue consumer loans.